Best AI Data Visualization Tools for Charts and Dashboards
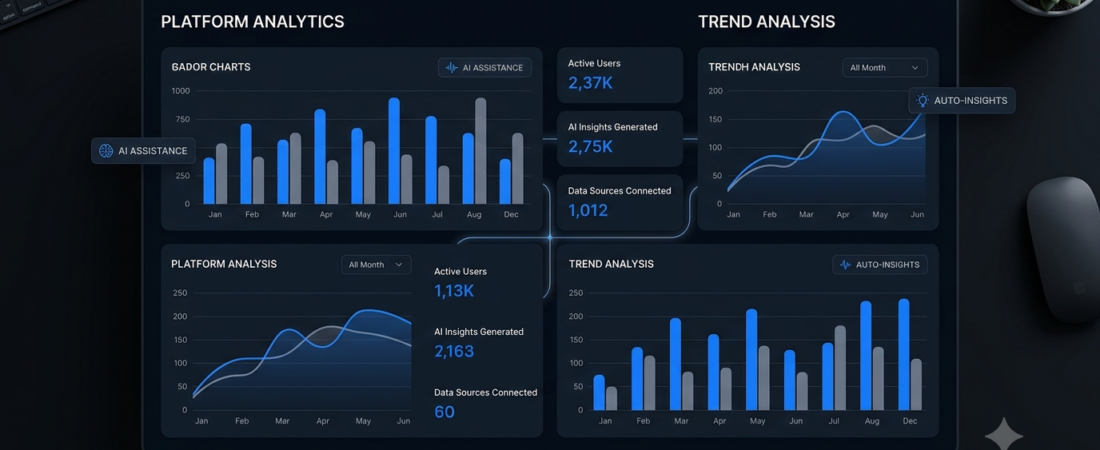
AI data visualization tools help users turn spreadsheets, tables, and datasets into charts, graphs, and dashboards without spending hours creating visuals manually. Whether you are a student, content creator, analyst, or business owner, these tools can make complex information easier to understand.
Instead of building every chart from scratch, you can use AI to explore data, identify patterns, and generate visual reports. However, the best tool for you depends on your data source, budget, technical experience, and need for customization.
In this guide, we compare five options for different data visualization tasks, including spreadsheet analysis, interactive dashboards, and AI-assisted reporting.
What Are AI Data Visualization Tools?
AI data visualization tools use artificial intelligence to help transform raw data into understandable visual formats. Depending on the platform, you may be able to upload a spreadsheet, ask questions in natural language, generate charts, or explore trends through an interactive dashboard.
For example, imagine you have a spreadsheet containing monthly sales figures. Rather than manually calculating every trend, you could ask an AI assistant to create a monthly sales chart and explain which products performed best.
Common uses include:
- Creating bar charts, line graphs, and pie charts.
- Exploring sales, marketing, and website analytics.
- Summarizing large spreadsheets.
- Building dashboards and reports.
- Identifying unusual changes or patterns in datasets.
- Preparing visual reports for presentations.
AI can speed up this process, but you should still verify calculations and conclusions before sharing the results.
5 Best AI Data Visualization Tools
1. Julius AI — Best for Natural-Language Data Visualization
Best for: Beginners, students, researchers, and business users.
Julius AI is designed to help people analyze data through conversational instructions. You can upload supported files, ask questions about the information, and request charts or graphs without writing code for every task.
For example, you could upload a CSV file containing website traffic data and ask Julius to visualize monthly visitors, compare traffic sources, or summarize important changes.
Key features:
- Generate charts and graphs from uploaded data.
- Ask questions about spreadsheets in plain English.
- Explore trends and statistical insights.
- Prepare reports and presentations from analysis.
Pros:
- Accessible to users with limited coding experience.
- Useful for exploratory analysis.
- Supports common file formats, including CSV and Excel.
Cons:
- Usage limits and available features may depend on the plan.
- AI-generated calculations still require verification.
Verdict: Julius AI is a practical starting point if you want to move from a spreadsheet to charts and explanations with minimal manual work.
Website: https://julius.ai/
2. Tableau — Best for Professional Dashboards
Best for: Analysts, teams, and organizations working with business data.
Tableau is an established data visualization platform used to create interactive dashboards and explore information from different sources. Its AI features include assistance with visualization creation, data exploration, and explanations of insights, although availability depends on the product, configuration, and subscription.
For example, a sales team could use Tableau to monitor revenue, compare regional performance, and track important business metrics through a dashboard.
Key features:
- Interactive charts and dashboards.
- AI-assisted data exploration and visualization.
- Tools for analyzing business metrics.
- Options for sharing insights with teams.
Pros:
- Suitable for detailed, interactive dashboards.
- Offers extensive visualization and customization options.
- Useful for recurring business reporting.
Cons:
- Requires more learning than a simple chat-based tool.
- Some AI features require specific plans or administrator settings.
Verdict: Choose Tableau if your goal is to build professional dashboards rather than generate a few charts from a spreadsheet.
Website: https://www.tableau.com/
3. Microsoft Power BI — Best for Business Reporting
Best for: Businesses, reporting teams, and people who already work with Microsoft tools.
Microsoft Power BI helps users connect data sources, create reports, and build interactive dashboards. AI capabilities available in supported Power BI environments can assist with exploring data, understanding reports, and working with analytics.
It is particularly relevant when an organization needs more than a single chart. For example, a company might use a dashboard to monitor monthly sales, customer trends, inventory, and performance across different locations.
Key features:
- Interactive business reports and dashboards.
- Data modeling and visualization.
- Connections to supported business data sources.
- AI-assisted analysis in eligible configurations.
Pros:
- Suitable for ongoing business reporting.
- Supports detailed, interactive visualizations.
- Useful for teams that need to share reports.
Cons:
- Data modeling can take time to learn.
- Some sharing and AI capabilities depend on licensing and setup.
Verdict: Power BI is worth considering when you need a repeatable reporting system for business data instead of a one-time chart.
Website: https://powerbi.microsoft.com/
4. ChatGPT — Best for Quick Charts and Data Exploration
Best for: Students, freelancers, and people who want to explore data conversationally.
ChatGPT can help analyze supported uploaded datasets and create charts or other visual outputs, depending on the model, tools, and features available to your account.
You might upload a spreadsheet of monthly expenses and ask for a category comparison, a trend chart, or an explanation of unusual changes. You can then refine the result by requesting different labels, time periods, or chart types.
Key features:
- Conversational analysis of supported files.
- Help interpreting tables and datasets.
- Chart creation in supported workflows.
- Assistance explaining results in plain language.
Pros:
- Flexible for different kinds of data questions.
- Useful for exploring unfamiliar datasets.
- Can help explain charts to nontechnical users.
Cons:
- Available capabilities vary by plan and interface.
- Incorrect assumptions or calculations are possible.
- It is not automatically a replacement for a managed business intelligence system.
Verdict: ChatGPT is a convenient option when you want to ask questions about data and create visualizations as part of a broader workflow.
Website: https://chatgpt.com/
5. Claude — Best for AI-Assisted Visual Exploration
Best for: Users who want conversational assistance with data and visual explanations.
Claude is an AI assistant that can help users reason about information, work with supported files, and explain analytical results. Anthropic also announced new dashboard and animation capabilities for Claude in October 2026, expanding its visual and analytical workflows. Access and exact functionality may depend on the current product experience.
For example, you might ask an AI assistant to examine a dataset, explain its main trends, and help present the results in a more understandable format.
Key features:
- Conversational help with analyzing information.
- Assistance interpreting data and explaining findings.
- Visual and dashboard-related capabilities in supported experiences.
- Help organizing findings into clear summaries.
Pros:
- Useful for explaining complicated information.
- Supports a conversational approach to analysis.
- Can help turn findings into understandable narratives.
Cons:
- Capabilities may differ by plan and rollout.
- You should confirm that your account supports the exact visualization workflow you need.
- Important numerical results must be checked against the original data.
Verdict: Claude is worth exploring if you want AI-assisted analysis and visual explanations in a conversational environment.
Website: https://claude.ai/
Comparison Table: Which AI Visualization Tool Should You Choose?
| Tool | Best Use | Main Strength |
|---|---|---|
| Julius AI | Spreadsheet analysis | Natural-language questions and charts |
| Tableau | Professional dashboards | Interactive visualization |
| Microsoft Power BI | Business reporting | Connected reports and dashboards |
| ChatGPT | Quick data exploration | Flexible conversational analysis |
| Claude | Visual exploration and explanations | Conversational reasoning and supported visual workflows |
This comparison is based on the tools’ general capabilities, not a controlled performance test. Features, prices, and access can change, so check each official website before choosing a subscription.
How to Choose the Right AI Data Visualization Tool
The right platform depends on what you want to accomplish.
1. Consider Your Experience
If you are new to data analysis, start with a conversational tool that lets you upload a supported file and request a chart in plain English. If you need advanced dashboards, consider learning a dedicated business intelligence platform.
2. Check File Compatibility
Before uploading a dataset, confirm that the platform supports your file format and size. Also check whether it can handle multiple spreadsheet tabs, missing values, date fields, and the data sources you use.
3. Compare Free and Paid Features
Some tools provide limited free usage, while advanced features may require a subscription or particular license. Check current pricing, export limits, and dashboard-sharing options rather than assuming every feature is free.
4. Prioritize Accuracy
A polished chart can still contain incorrect information. Check the source data, totals, units, date ranges, and calculation methods. For business decisions, independently verify important findings.
5. Protect Sensitive Information
Avoid uploading confidential customer information, financial records, or other sensitive data unless you have permission and understand the platform’s privacy and data-handling terms.
If your main objective is to improve your daily workflow, explore our guide to AI productivity tools. Business owners may also find our guide to AI tools for small business useful.
Useful Prompts for Creating Charts with AI
You can often get better results by explaining your dataset, the question you want answered, and the type of chart you need.
Try these prompts with a tool that supports your chosen file and visualization workflow:
For sales data:
“Analyze this sales spreadsheet and create a line chart showing monthly revenue. Label the axes clearly, identify missing values, and explain the main trends without assuming causes that the data does not prove.”
For website analytics:
“Create a bar chart comparing website traffic by source. Show the values, sort the categories from highest to lowest, and summarize the differences.”
For student research:
“Turn this research dataset into an appropriate chart. Explain why the chart type fits the data and mention any limitations that could affect the interpretation.”
For business reporting:
“Create a concise dashboard summary from this dataset. Highlight the main metrics, explain significant changes, and identify any calculations that need independent verification.”
Always review the output before publishing it or using it to make decisions.
Frequently Asked Questions
What are the best AI data visualization tools?
Julius AI, Tableau, Microsoft Power BI, ChatGPT, and Claude are options worth evaluating. The best choice depends on whether you need quick charts, spreadsheet analysis, or interactive dashboards.
Can AI create charts from Excel files?
Yes. Some AI tools can analyze supported Excel files and generate charts from the data. File size, spreadsheet structure, and feature availability may affect the result.
Are AI chart generators free?
Some provide limited free access, while others require paid plans for advanced analysis, larger datasets, or collaboration. Check current pricing before signing up.
Can AI create dashboards without coding?
Yes, certain tools offer visual dashboard builders or conversational workflows that reduce the need for coding. However, advanced data preparation, integrations, and customization may still require technical knowledge.
Are AI-generated charts always accurate?
No. AI tools can misinterpret columns, use incorrect calculations, or overlook missing data. Verify the underlying numbers and chart labels before relying on the results.
Conclusion
AI data visualization tools can make it easier to turn raw information into charts, graphs, and useful reports. Julius AI and ChatGPT are worth exploring for conversational analysis, while Tableau and Power BI are strong candidates for more structured dashboard workflows. Claude is another option for conversational analysis and supported visual experiences.
Start with a small, non-sensitive dataset, compare the results, and choose a tool that fits your actual workflow. Most importantly, verify the data before trusting the conclusions.
Want to explore more practical AI tools? Browse Aiventa Guide for guides that help you choose software for learning, productivity, and business.